Nature’s Electromagnetic Symphony – Whistlers
The one with the weird atmospheric sounds. And not to forget, a night-out.Guest Author: Sreekar
As part of my Engineering Electromagnetics course this semester, we had to make a poster on a topic of our interest which involved electromagnetics, which we had to present at our department.
Some Background#
With my exams of the course having gone really bad (I still have nightmares about it :( ), I was determined to make my group’s poster one of the best that will be put up on poster day. The three of us, Sreekar, Nithin Varma and I searched the internet for a topic that was “unconventional” and interesting. After a week or so of following links on Wikipedia1, I came across this article— Whistler (radio) ,which caught my eye. It was a topic that most would have not heard about and would be very much interested in learning about it.
Before I start explaining the technical details of the poster, do take a look at the poster we made (click on it for a PDF).
So here it goes.
Technical Details#
History and Discovery#
In World War I, soldiers used long communication lines to maintain contact with their base. The people on the receiving side of the line, often could hear sounds that were very similar to that of “falling grenades”, when there were none falling. One keen observation was that this particular sound was heard during lightning strikes.
Here’s a short sound clip of what they heard:
| Audio Clip 1 | Audio Clip 2 |
|---|
Courtesy: NASA Van Allen Probes
The first one, in which you would have noticed a tone of descending frequency, is called a Whistler, while the second, which consists of rising and falling tones of frequency is a Chorus. This post will talk more on whistlers as they are more extensively studied among the two.
Whistlers are Very Low Frequency (VLF) emissions in the atmosphere that are characterised by a tone of rapidly descending frequencies.
Being long-wavelength (~ 100 km!!) EM Waves, it’s understandable that they couple into communication lines that are as long as 100 km. This explains the strange noises heard by soldiers in WWI.
Sources and generation of whistlers#
A natural question to ask is how these waves are generated in the first place. The literature on this is limited, but there is considerable evidence to say that the source of whistlers must be not very different from lightning.
The only known characteristic of whistlers that distinguishes it from ordinary lightning is their relatively high energy content. After accounting for attenuation losses, the estimated electromagnetic energy in a whistler producing stroke is about ten times as great as that in the average lightning flash. A sufficiently strong lightning flash should be able to produce whistler-mode signals.
But here’s the thing - we also detect these waves at locations where there may be no lightning at all. In fact, these waves can also be detected at places whose magnetically conjugate point has experienced a lightning strike. That means that there must be some mode of propagation that is making this possible. The theory behind it’s propagation can be intuitively understood using the basic concepts of a waveguide.
Waveguides#
A waveguide is a structure that guides waves, such as electromagnetic waves or sound, with minimal loss of energy by restricting expansion to one dimension or two. Without the physical constraint of a waveguide, wave amplitudes decrease according to the inverse square law as they expand into three dimensional space. — Wikipedia
One very popular waveguide is the ubiquitous optical fibre cable that you might be using for the internet connection to your home.
The simplest, idealised example of a waveguide is a parallel plate waveguide, in which the wave is constrained between two conductors. Solving Maxwell’s equations and applying boundary conditions will give us a solution which has a wave that propagates in a direction tangential to the plates.
Now, consider the earth and the ionosphere. The earth is a good conductor, in the sense that at the frequencies we are talking about (KHz), the loss tangent2, is about 600.
The ionosphere, as its name suggests, has a lot of ions, making it a good conductor as well. What we now have is a waveguide through which EM waves, more specifically VLF waves, can be guided through.
Propagation of Whistlers#
Energy from a lightning source near the earth’s surface travels in the earth-ionosphere waveguide and enters the ionosphere continuously along the lower surface of the ionosphere. Wave components that enter the ionosphere at the location of a duct are then trapped and “conveyed” to the opposite hemisphere along the same magnetic line of force, which are aligned exactly along the duct, where they emerge from the ionosphere and re-enter the earth-ionosphere waveguide.
So… a bunch of frequencies is generated by a lightning strike at a location, at the same time. All of them take the same path and reach another location. So, ideally we should be receiving all the frequencies at the same time. But we hear a tone of descending frequency. Why?
The reason lies in the ionosphere. The velocity of propagation of a wave through the ionosphere is dependent on it’s frequency. This leads to a dispersion of waves, with each frequency traveling at a different speed.

graph of $1/\sqrt{f}$ vs $t$
Source: Robert A. Helliwell, Whistlers and Related Ionospheric Phenomena, Stanford University Press, 1965
Due to the dispersion of waves in the ionosphere depending on their frequencies, different frequencies are received at different times, with the higher frequencies being received first, as seen from the above graph. This is why a whistler is a tone of descending frequency.
Detection of Whistlers#
The theory’s great. But how do we practically detect and hear these sounds?
Since these are electromagnetic waves, we have to first “capture” these EM waves, then transduce them, i.e. convert them to audio to actually hear the audio clips you heard before.
The wavelength of these waves are extremely huge (100 km for a 3KHz wave). This means that it is not possible to have a full-wavelength antenna3, for capturing the wave accurately. A typical VLF receiver is about 60ft long - there is very little signal current for reception. Using a cascaded combination of high gain, high input impedance (for better sensitivity) amplifiers and low pass filters, we can make up for the difference.

VLF Receiver Circuit
Source: http://www.home.pon.net/785/equipment/build_your_own.htm
Whistler Spectrograms - a vast ocean of information#
A spectrogram is a visual representation of the spectrum of frequencies of a signal as it varies with time
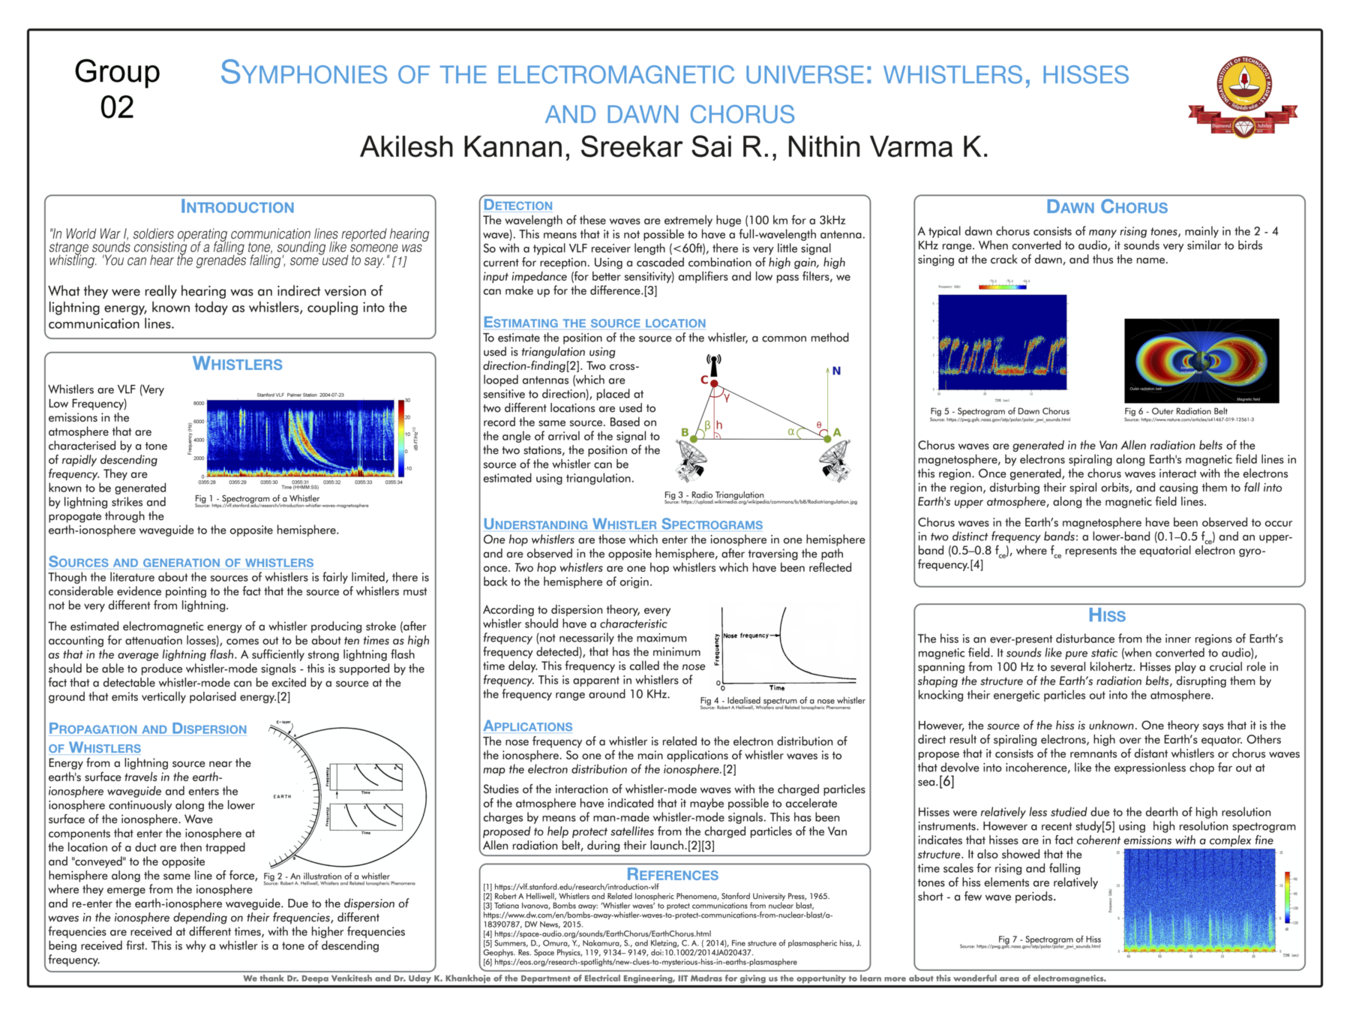
Whistler spectrogram
Source: https://en.wikipedia.org/wiki/Whistler_(radio)
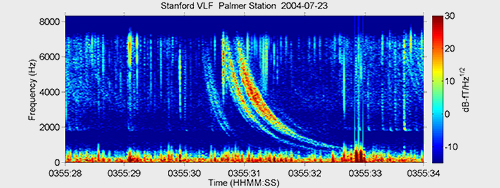
This is a real-life spectrogram of a whistler. At around 0355:29, you can a see a band of frequencies being generated. This is called a tweek.
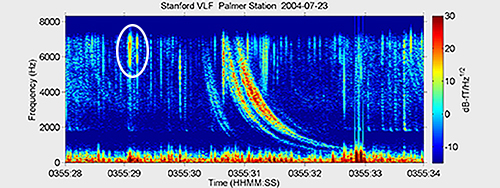
Tweek in a spectrogram
At near 0355:31, you see that the “tone of descending frequencies” has started. Notice how there’s a time delay between the tweek and the start of the whistler. This tells us that it is detected elsewhere (remember the magnetically conjugate point?), meaning it has travelled (or the whistler has been detected at the same place as the tweek.)
According to Robert A. Helliwell , in his book Whistlers and Related Ionospheric Phenomena, the idealised spectrogram for a whistler is:

Ideal Whister Spectrogram
Source: Robert A. Helliwell, Whistlers and Related Ionospheric Phenomena, Stanford University Press, 1965
There’s a lot more in the above diagram than just ideal spectrograms. The figure shows us a wealth of information.
If you look closely, we can see the ideal spectrogram containing all the “reflections” of the whistler.
Reflections? Well, as the tweek propagates, I had mentioned that the tweek generated would travel into an ionospheric duct, then come back into the earth-ionosphere waveguide. Well, EM waves—in fact any wave—simply don’t do nothing when they travel from one medium to another.
Because of the change in refractive indices of the media, some of the energy carried by the waves will be reflected into the first medium, and the rest will be transmitted into the second (there’s also absorption of energy, but I’m ignoring that as it is very less compared to the other two).
In this part of the above figure,
Why are they getting dragged out more? Because, each undergoes a greater amount of dispersion than the previous as they travel a lot more distance after each reflection before detecting them.
Similarly, in this part of the figure,
I had mentioned that the waves get dispersed in the ionosphere, right? Well, later studies showed that according to dispersion theory, every whistler should have a characteristic frequency (not necessarily the maximum frequency detected), that has the minimum time delay. This frequency is called the nose frequency of the whistler. This nose frequency is very apparent in the whistlers whose frequency range about 10KHz.

Spectrogram of a Nose Whistler
Source: Robert A. Helliwell, Whistlers and Related Ionospheric Phenomena, Stanford University Press, 1965
In fact the spectrograms shown before are actually the lower half of the spectrogram of the nose whistler.
Practical Applications#
The nose frequency of a whistler is very closely related to the electron distribution of the ionosphere. So, one of the main applications of whistler waves is to map the electron distribution of the ionosphere.
Studies of the interaction of whistler-mode waves with the charged particles of the atmosphere have indicated that it maybe possible to accelerate charges by means of man-made whistler-mode signals. This has been proposed to help protect satellites from the charged particles of the Van Allen radiation belt, during their launch.
Other Useful Links#
There were quite a few interesting links that I chanced upon when going down this rabbit hole—ranging from building a VLF receiver by oneself, to a whole niche community of people interested in these.
- Build your own VLF Whistler Receiver
- The INSPIRE Project, Inc.
EDIT 19/Jan/21Radio Waves below 22KHz (Credits: Frank Woden)